Free & open source
Know every dollar
in your cloud
CostGoblin syncs your AWS billing data locally and queries it with DuckDB. No servers. No SaaS fees. Your data never leaves your machine.
CostGoblin syncs your AWS billing data locally and queries it with DuckDB. No servers. No SaaS fees. Your data never leaves your machine.
No infrastructure to provision or maintain. CostGoblin runs entirely on your laptop as a native desktop app.
Billing data is downloaded to your machine as Parquet files. Nothing is sent to any third party. Ever.
Analytical queries over months of billing data complete in milliseconds. Filter, drill down, and slice by any dimension.
Once synced, your data lives on your machine. Analyze cloud costs from a plane at 10,000 meters — no Wi-Fi required.
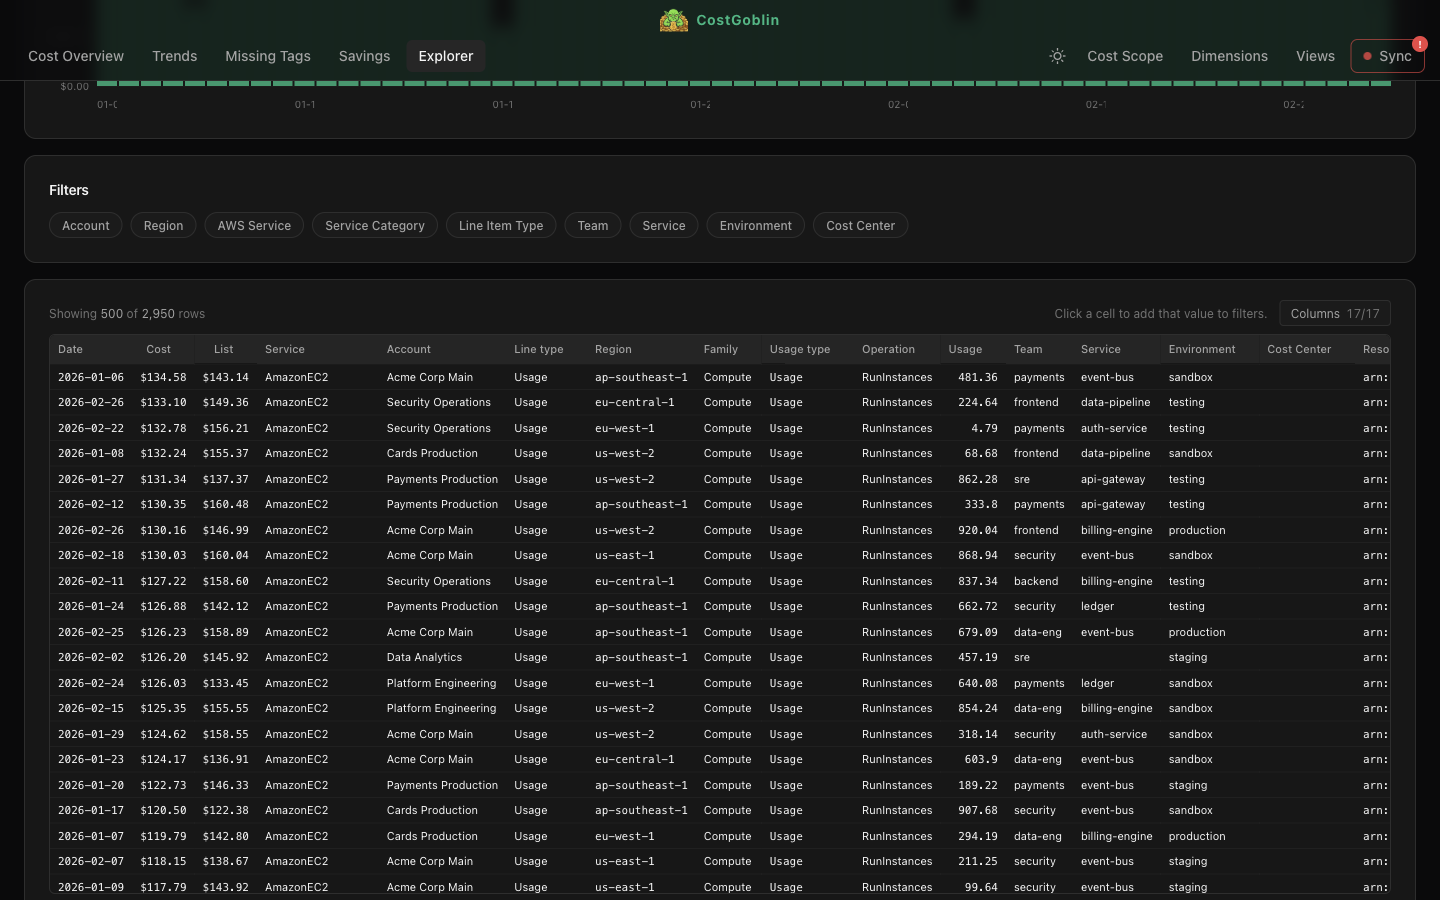
Filter, sort, and explore the raw CUR dataset. See daily totals at a glance, slice by any dimension, and click any cell to drill deeper. Thousands of line items queried in milliseconds.
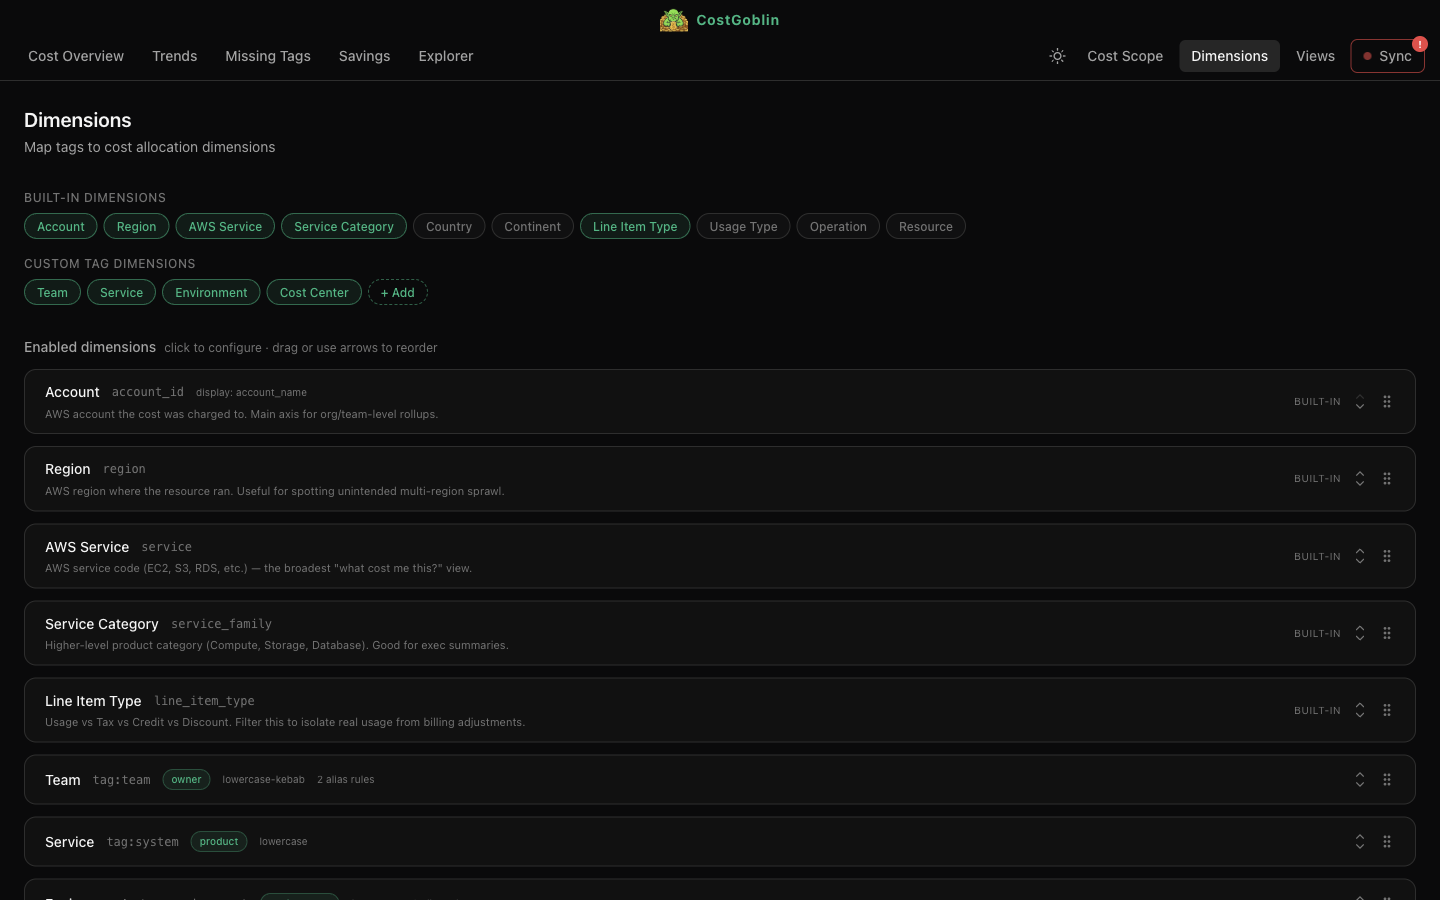
Normalize messy tags with aliases and casing rules applied at query time. Create custom allocation dimensions from any tag key. Changes take effect instantly — no re-processing.
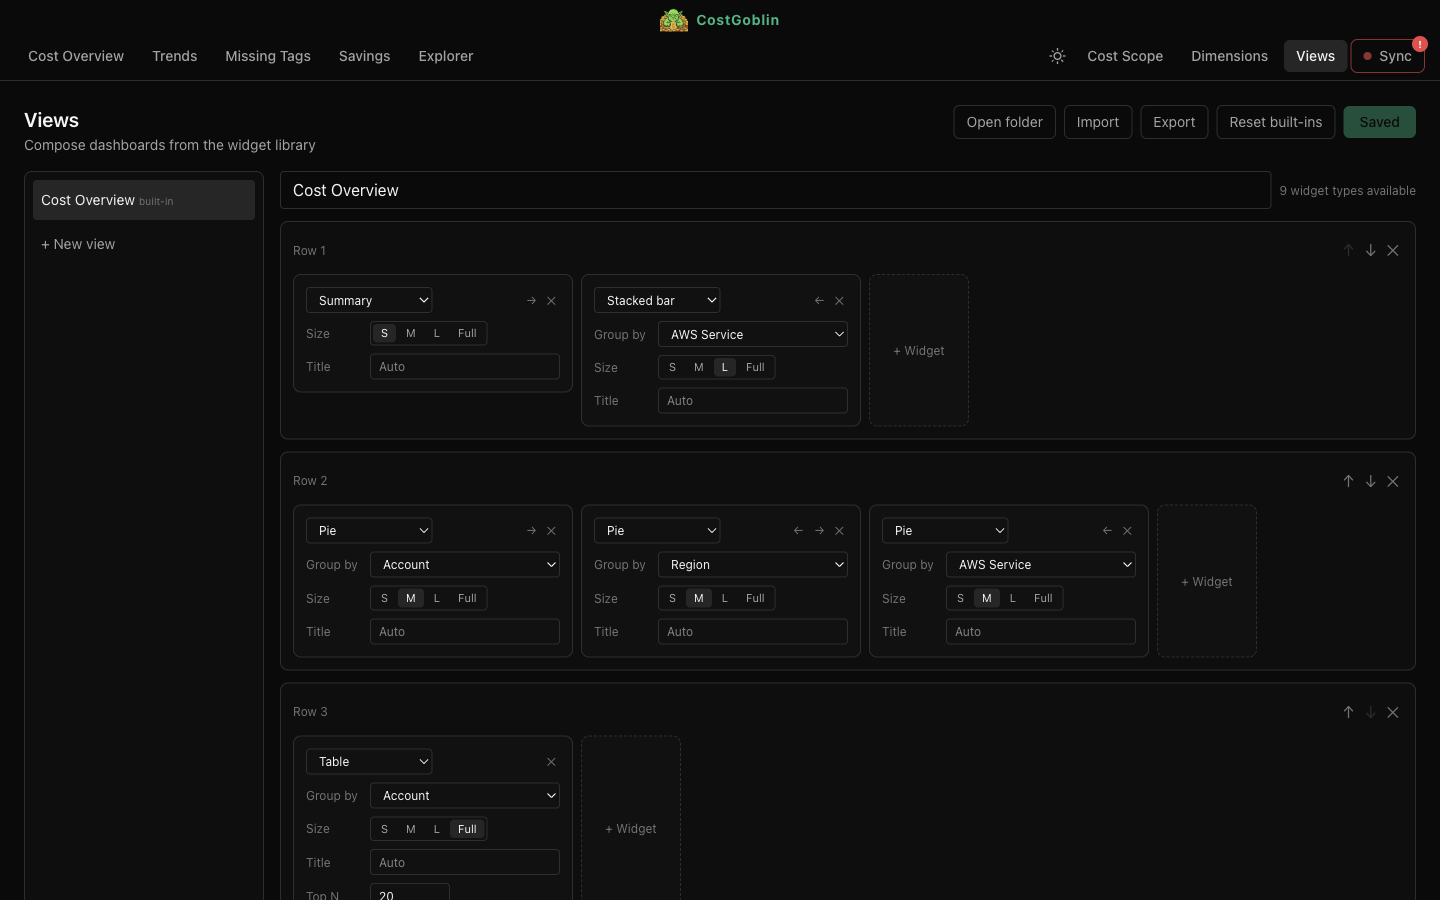
Compose custom views from a library of widgets — summary cards, stacked bars, pie charts, tables. Drag to reorder, resize, and group. Export and share as YAML.
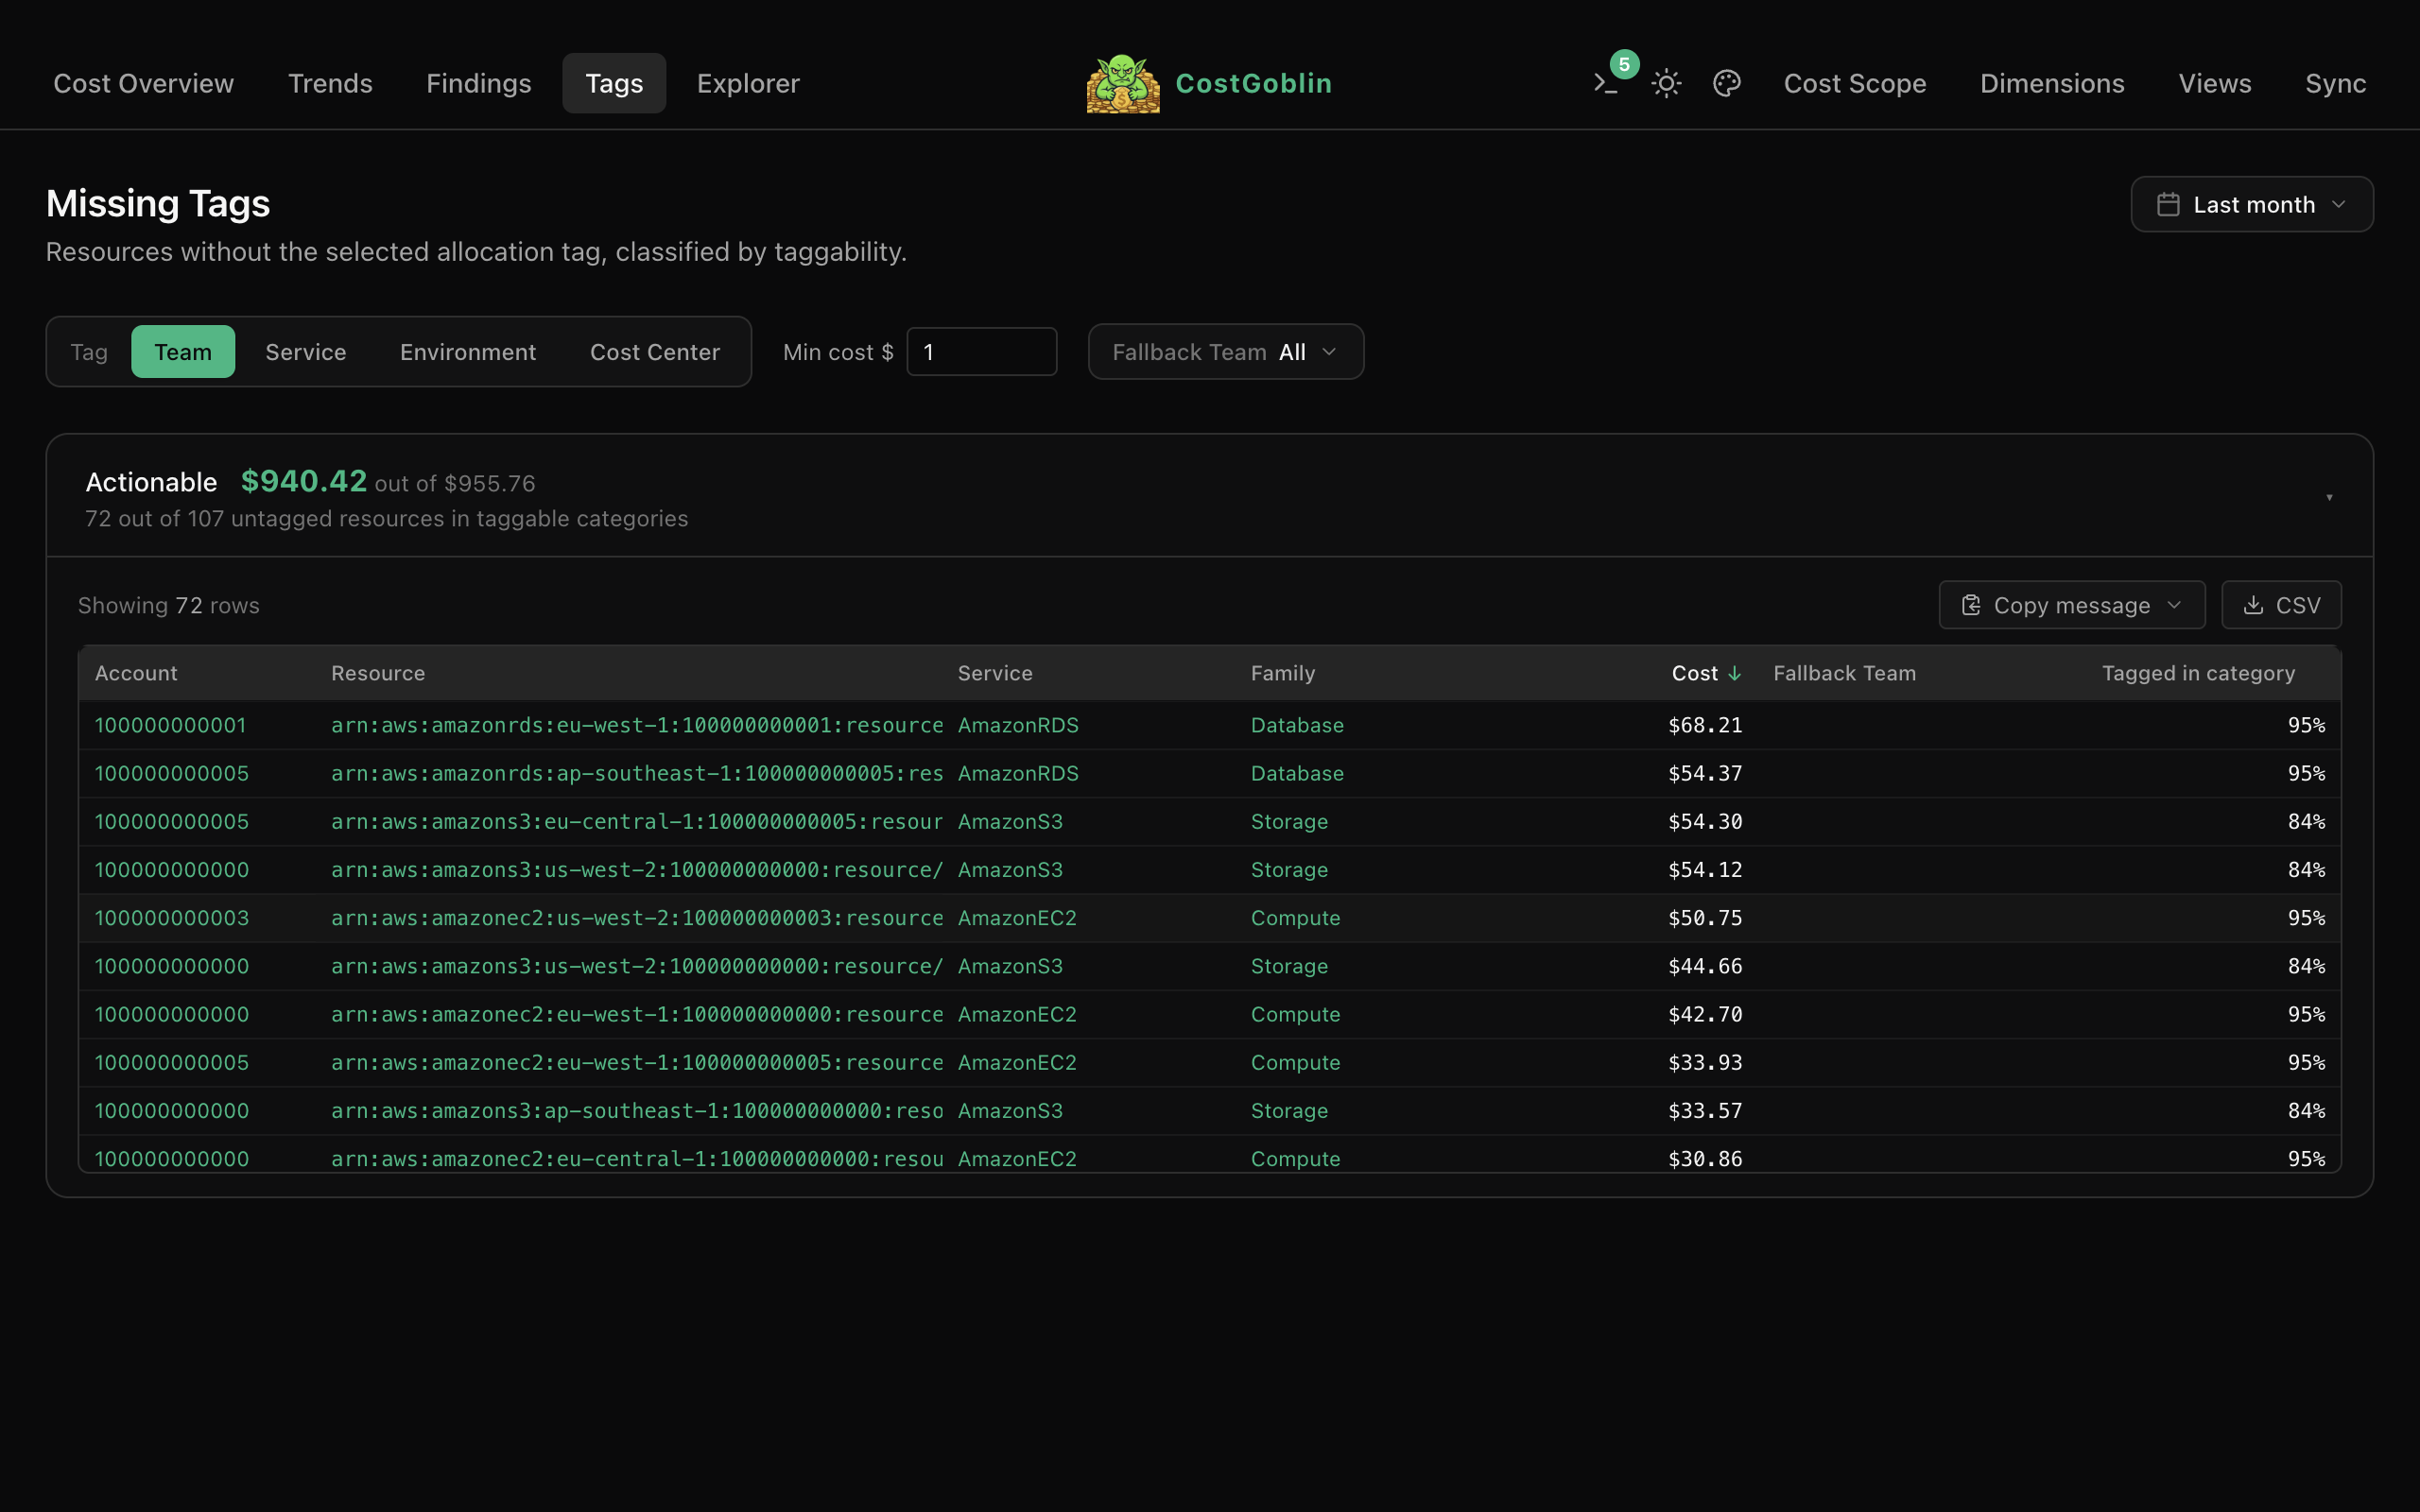
See which resources are missing allocation tags, grouped by actionable vs. untaggable. Filter by dimension, minimum cost, or fallback owner. Copy findings to Slack or Jira in one click.
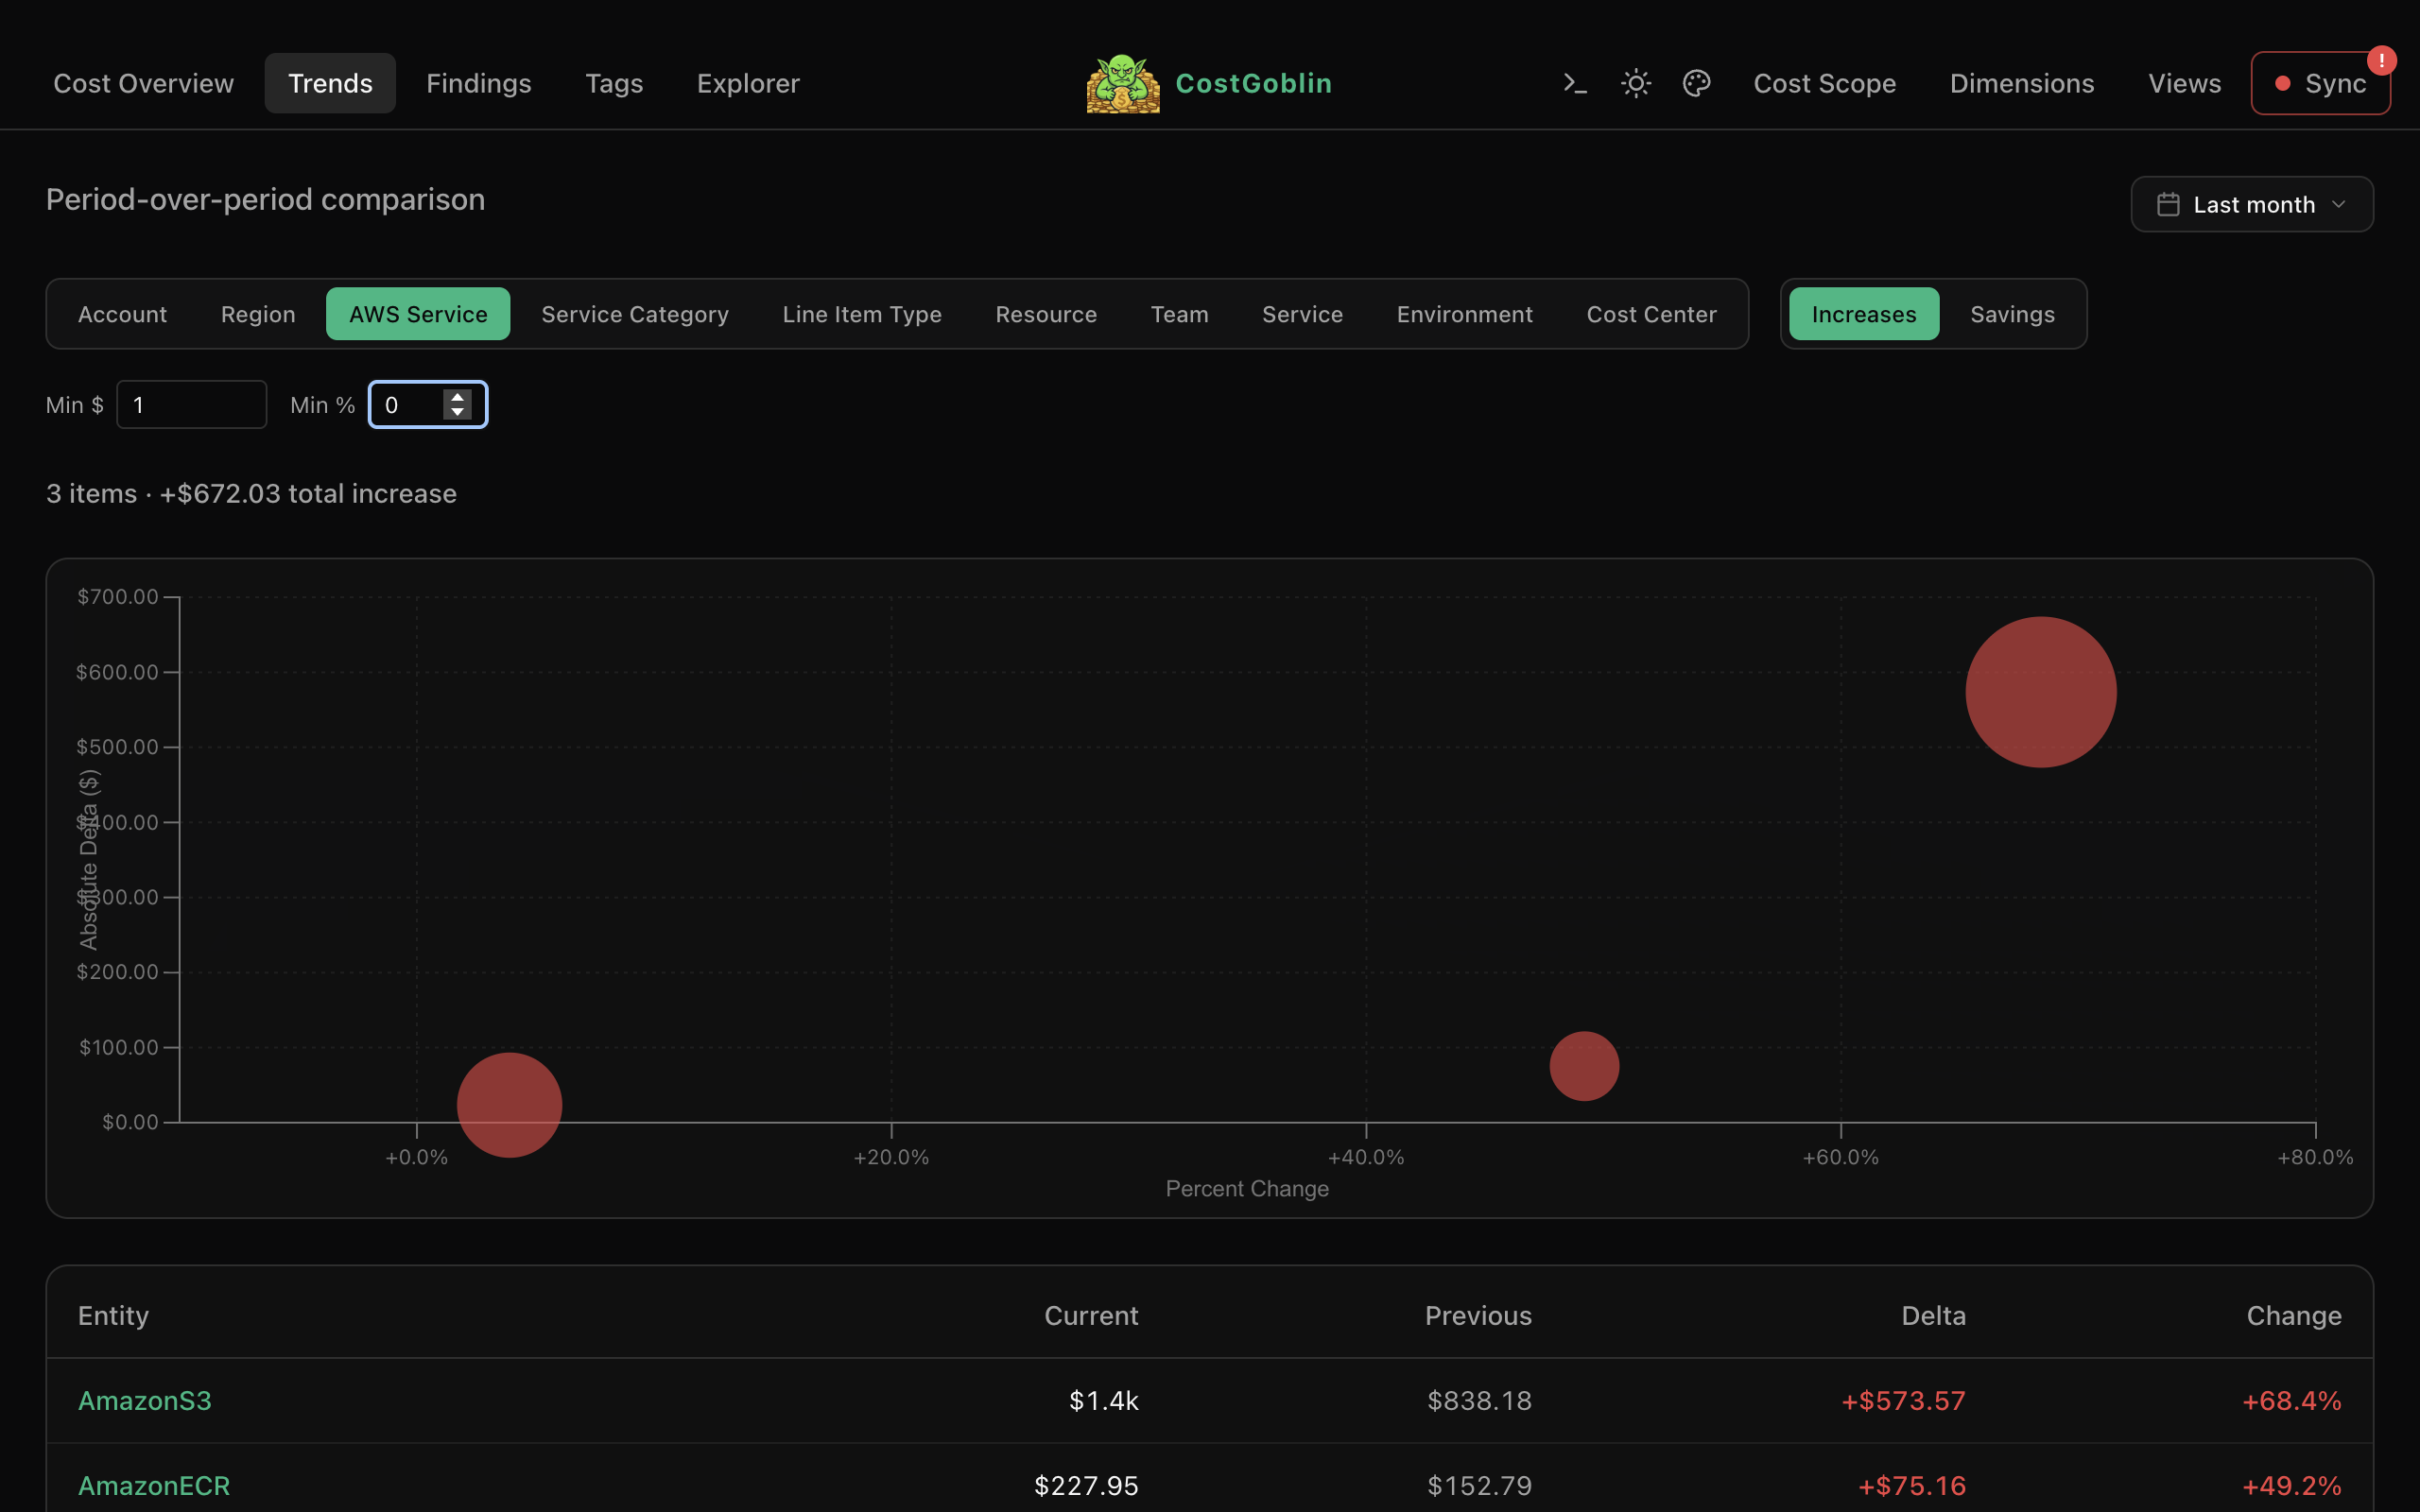
Period-over-period bubble chart shows cost increases and savings at a glance. Bubble size maps to current spend. Filter by minimum dollar or percent change, drill into any entity.
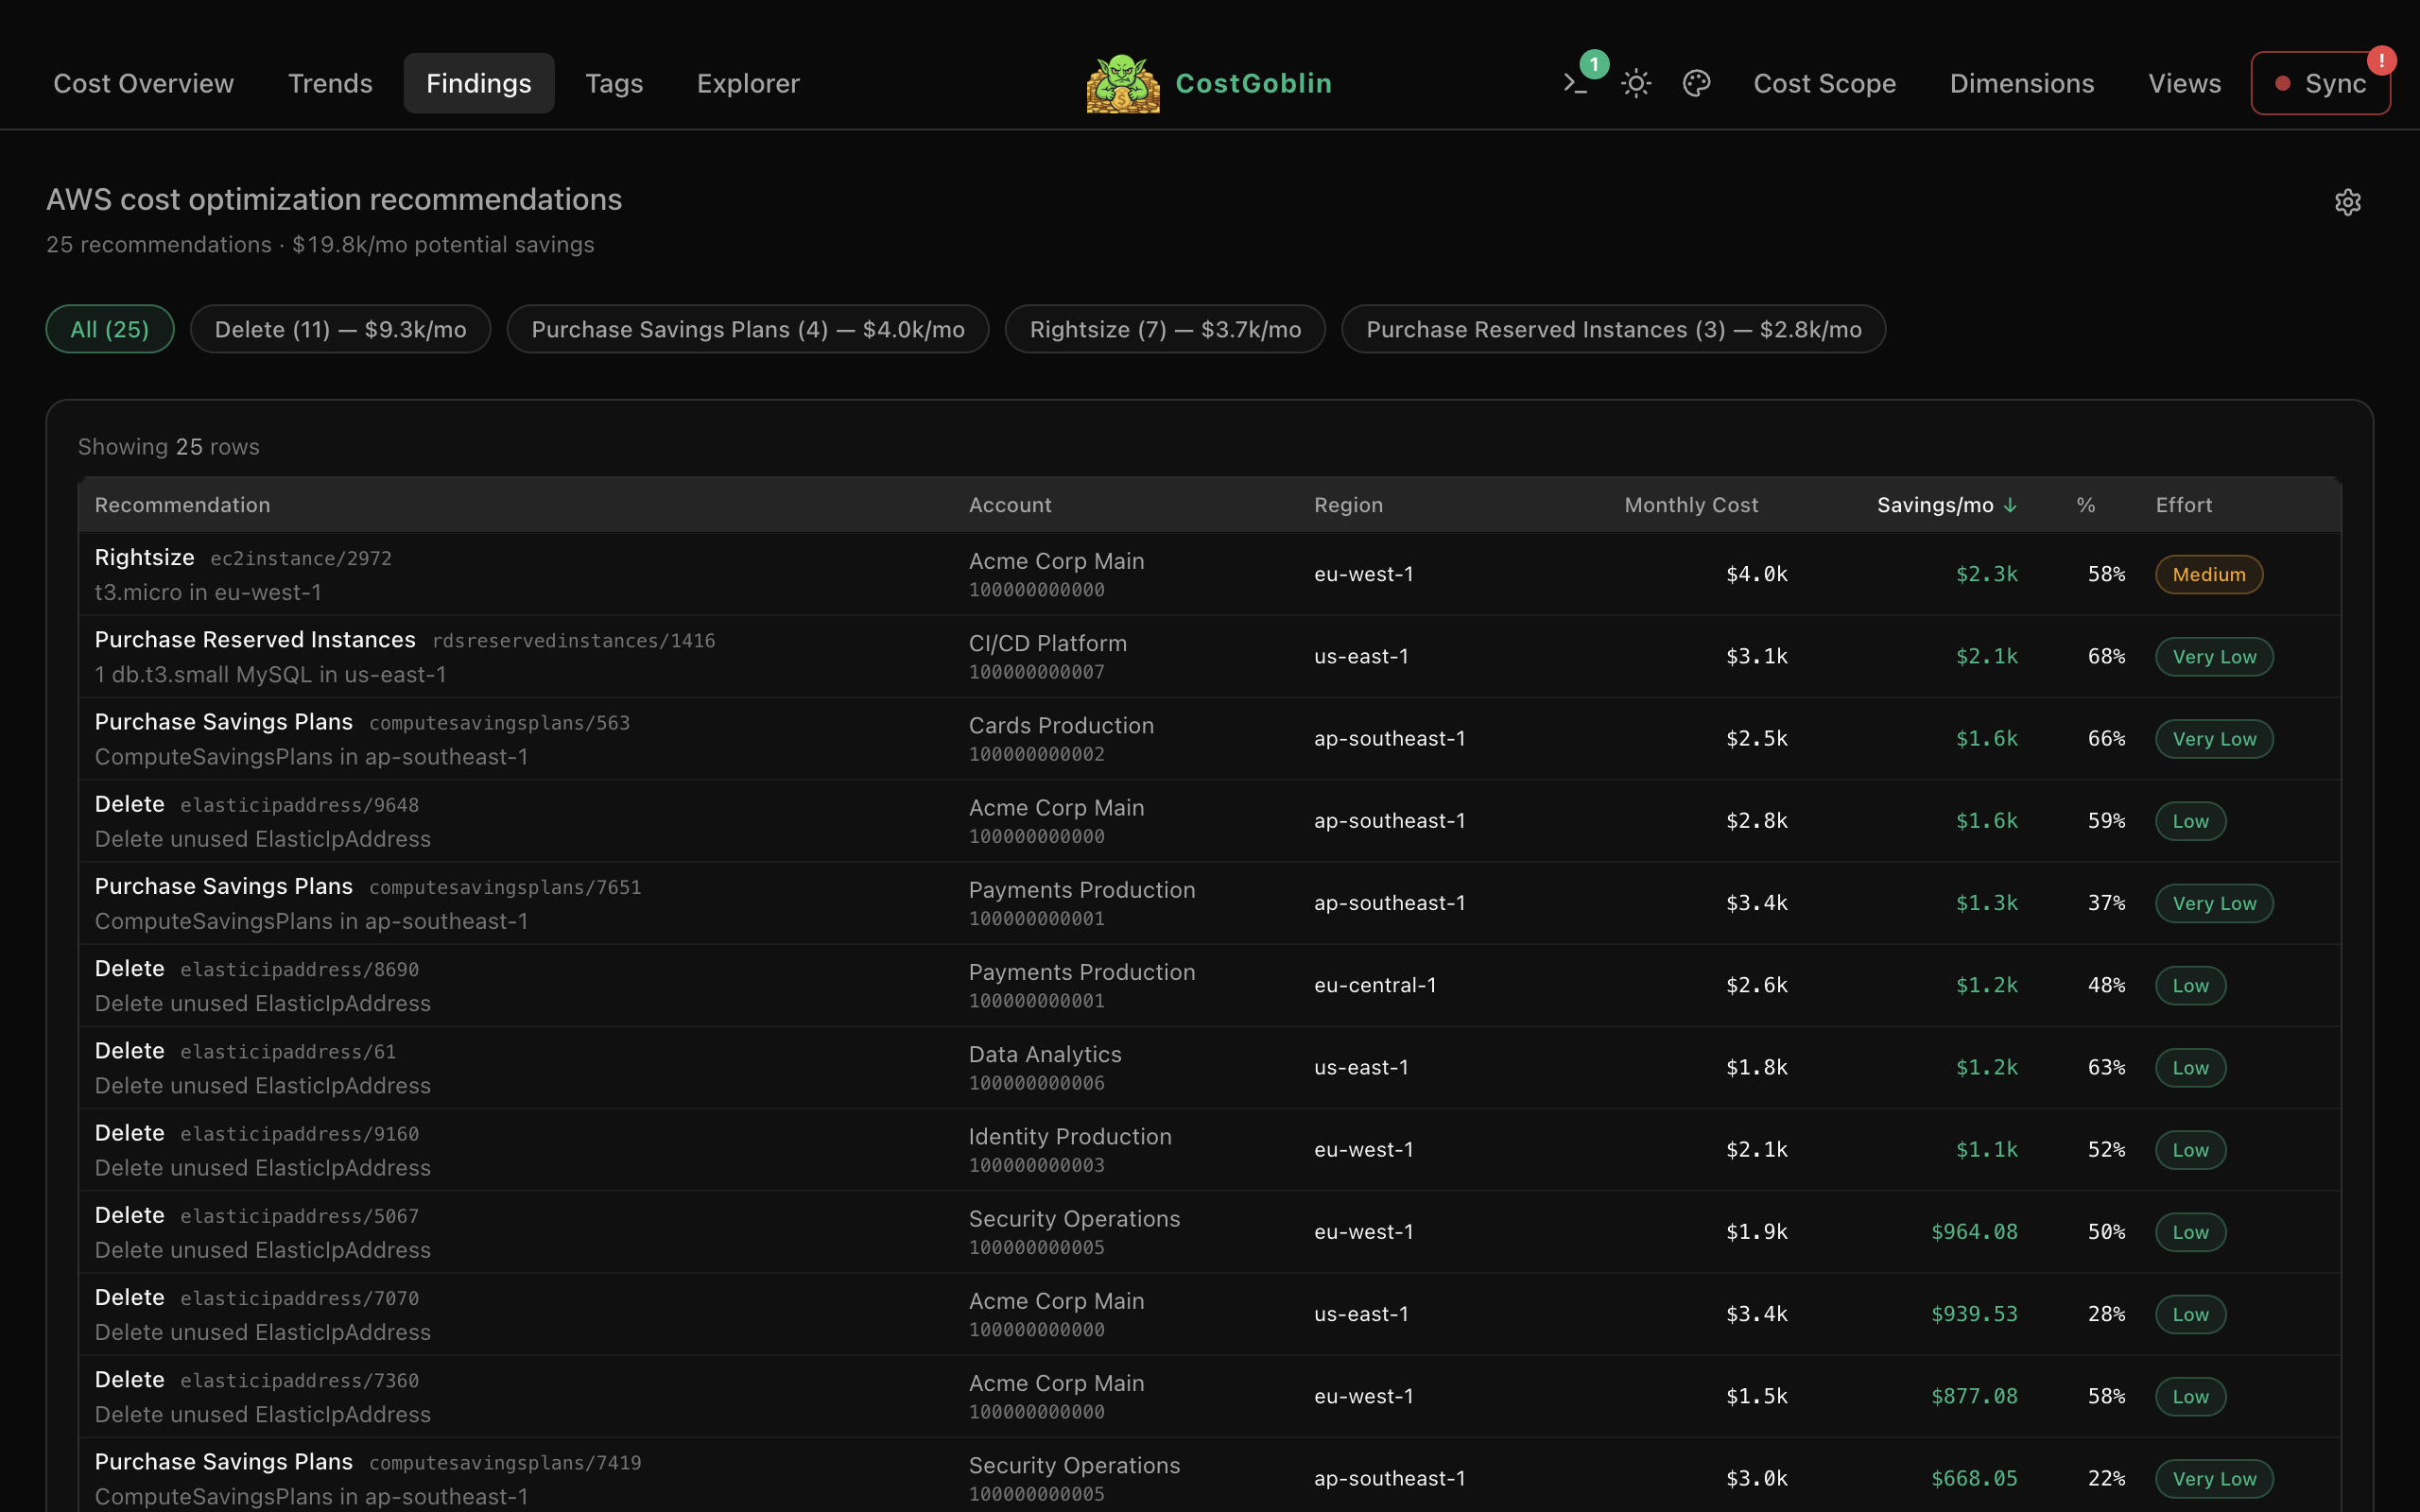
AWS optimization recommendations sorted by monthly savings. See effort level, expand for full resource details, and filter by action type — rightsizing, reserved instances, deletions.
Connect any AI assistant via the Model Context Protocol. 10 tools let agents query costs, explore trends, and drill into details — all backed by your local DuckDB data.
Downloads AWS Cost and Usage Reports from S3 and stores them as optimized daily Parquet files.
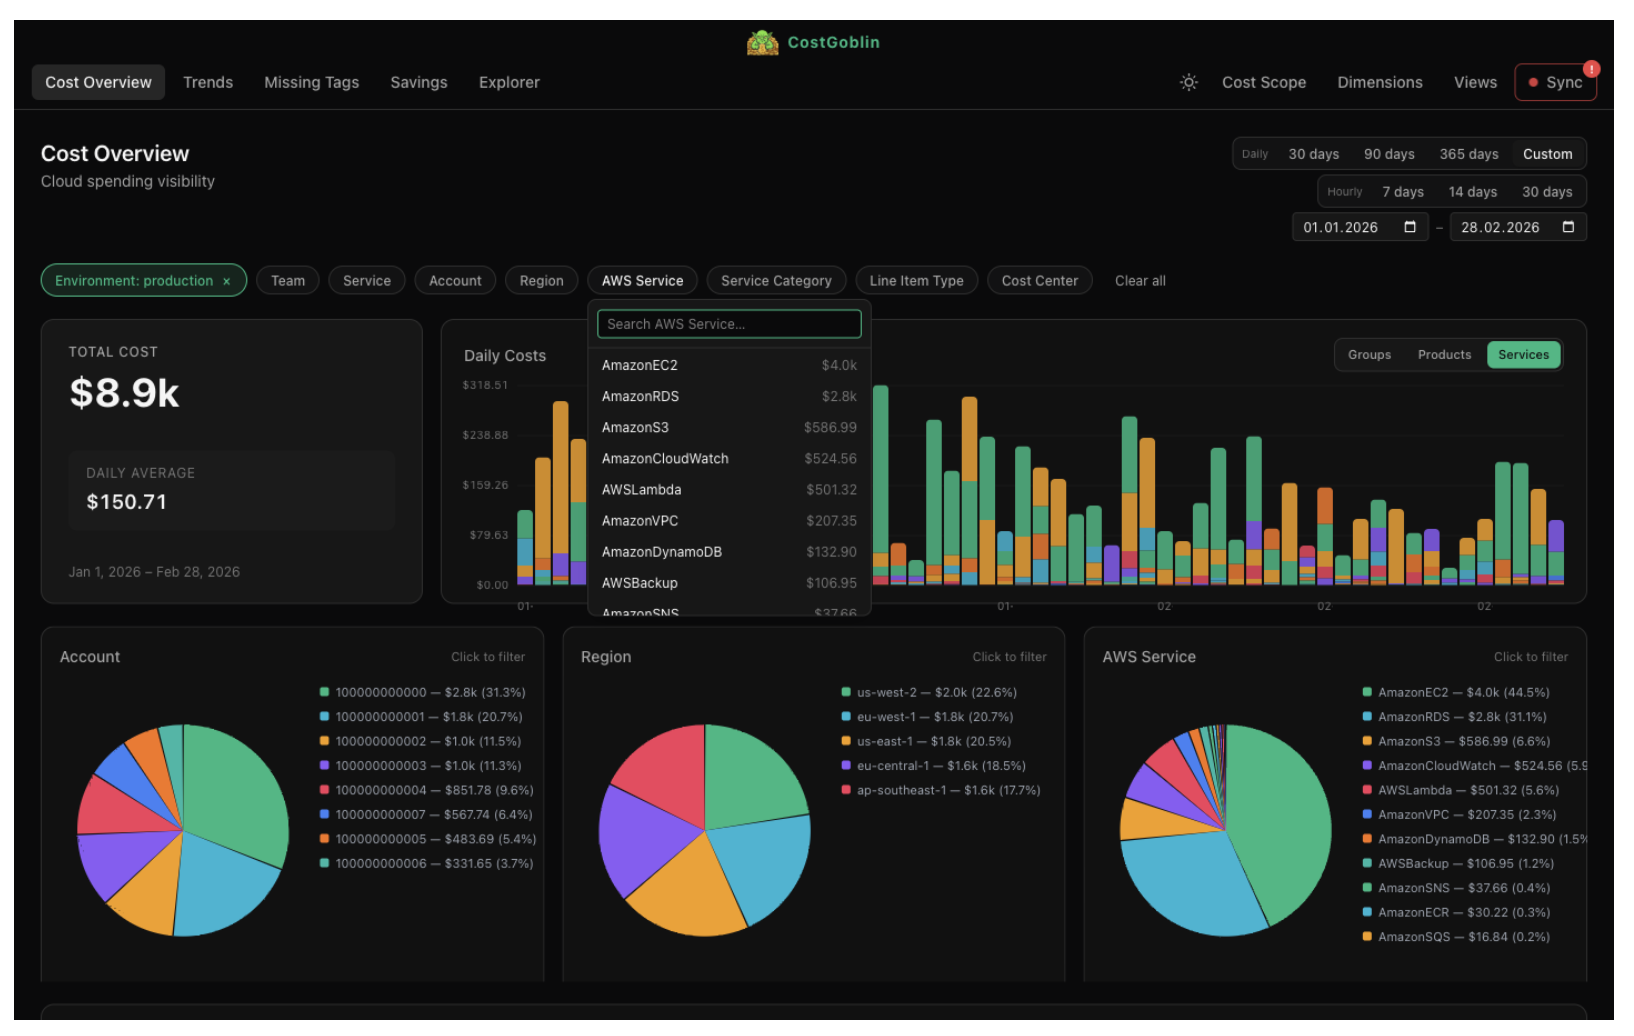
Slice costs by account, service, region, team, product, environment, or any custom tag.
Aliases and normalization rules applied at query time. Fix messy tags without re-processing data.
Click through from service to service family. Filter by environment. Cross-chart interactions update everything.
See which accounts, services, or teams are trending up. Spot anomalies before they become incidents.
Map all your AWS accounts with aliases and hierarchy. Drill into any account or roll up across the org.
Expose cost data to Claude, ChatGPT, or any MCP-compatible AI. 10 tools for querying, trends, and ad-hoc SQL.
Export any view to CSV for reporting and budgeting. Share dashboard configurations as portable YAML files.
Before setting up any exports, make sure the tags you want to slice costs by are activated in the AWS Billing Console → Cost Allocation Tags.
Activate any user-defined tag you plan to use as a dimension in CostGoblin (e.g. team, environment, service). Tags that aren't activated here won't appear in the CUR exports, no matter how they're configured.
Pick a dedicated bucket (or prefix) for all CostGoblin data. We recommend this structure so each export lands in its own namespace:
In the AWS Billing Console → Data Exports, create two exports. Select Cost and usage report (CUR) as the data table and configure each one as follows:
Under Column selection, enable these and disable the rest to keep file sizes small:
In the AWS Billing Console → Cost Optimization Hub → Preferences, enable the S3 data export:
Open CostGoblin, go to Sync and point each data source to its S3 prefix. Once the first sync completes, head to Dimensions to map your tags to cost allocation dimensions. This is where CostGoblin shines — for each dimension you can:
Automatic alerts when spending deviates from historical patterns. Catch surprises before the bill lands.
Set spending targets per team, product, or environment. Track burn rate against budget in real time.
Share dashboards and cost reports with your team. Collaborative triage for cost spikes.
GCP and Azure billing support alongside AWS. One interface for all your cloud spend.
New features, releases, and cloud cost insights. Low volume, high signal.